One emerging technology in use by communities on the frontlines of climate change is participatory mapping. Using mobile devices with GPS and text messaging, people in areas without formalized public transit are increasingly invited to contribute to the mapping of local service and travel routes.
Urban planning has used participatory maps since the 1930s. Today, these maps "show the community back to itself, revealing hot spots of local corruption and pollution, giving activists the tools to target particular places with investigation or protest" (Guldi, 2017, p. 98).
For this post, I've created a map using OpenStreetMap and Leaflet.js. (WordPress does not have an Embed block for OpenStreetMap, so I've linked to a self-hosted site below the screenshot.)
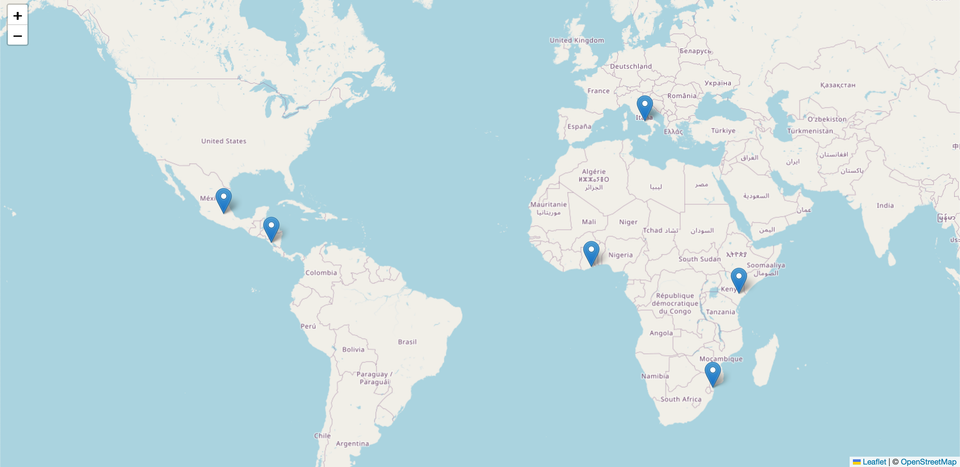
See the full map Each marker on the map provides a brief description and a link to the map for projects in the following places:
- Accra, Ghana
- Managua, Nicaragua
- Maputo, Mozambique
- Mexico City, Mexico
- Naples, Italy
- Tana River, Kenya
References
Chapas Project. (2018, February 20). Calendário 2018 com o mapa. https://chapasproject.wordpress.com/2018/02/20/calendario-2018-com-o-mapa/
Guldi, J. (2017). A history of the participatory map. Public Culture, 29(1), 79–112. https://doi.org/10.1215/08992363-3644409
Lehuby, N. (2019, June 26). Retour sur la cartographie d’Accra. Jungle Bus. https://junglebus.io/retour-sur-la-cartographie-daccra/
MapaNica. (n.d.). Rutas de Managua y Ciudad Sandino. https://rutas.mapanica.net
Mapatón CDMX. (2016, January 20). Home page. https://web.archive.org/web/20160120221654/http://www.mapatoncd.mx/
Ushahidi. (2022). Mappa interattiva del biciplan—piano urbano della mobilità ciclistica della città metropolitana di Napoli. https://mappabici-cmna.ushahidi.io/map
Ushahidi. (2022). Tana river climate change & livelihoods restoration project. https://tclirp.ushahidi.io/map