March 11, 2026
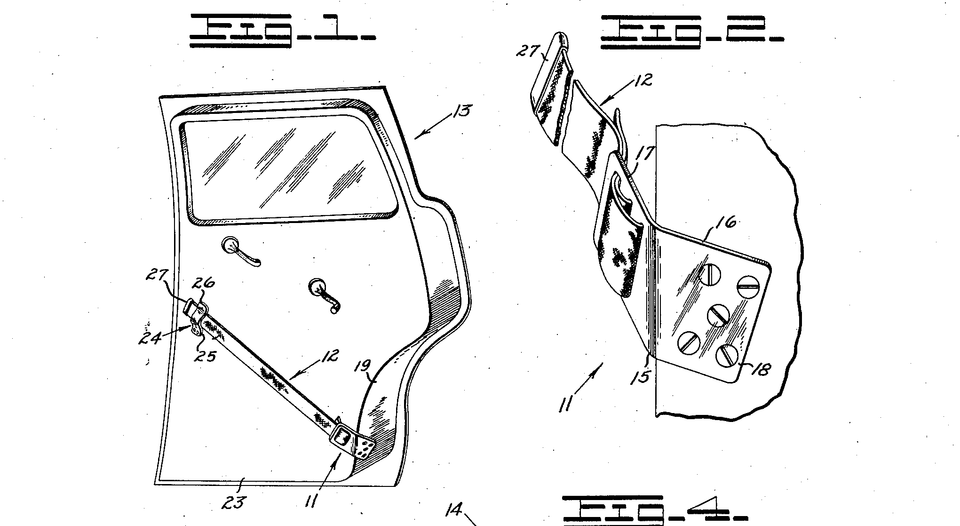
I wanted to know how long it took humans to invent the modern automobile seat belt. We take them for granted now as they are ubiquitous. But they weren't for a long time and I wanted to know for how long.
The answer, as always, depends on how you count. The first fatality in a steam carriage was in 1834, possibly due to an intentionally placed obstruction [1]. The first fatality in a motor car was scientist Mary Ward riding aboard a steam car in 1869. The modern consumer automobile was developed in 1886 (Benz), but lap belts were not available as a factory option until 1949 (Nash). Even then, nobody wanted them (the seat belts, that is, but Nash too.) The three point harness in cars was not patented in the US until 1955 and only started to be sold by Saab in 1958.
So for something like 72 years depending on how you count (from Benz to Saab, roughly), we as a species sold consumer cars without what we now consider to be basic safety equipment. And when we did, at least in the US, consumers shunned them. That's almost three generations! Benz made cars that would kill at a minimum his generation's children and grandchildren but for lack of a single essential design element.
Humans had already invented the seat belt by the turn of the century. The first modern seat belts were not in cars; they were designed for airplanes. This makes sense, as planes can yaw, pitch, and roll in the course of flight. WWI pilots had safety harnesses including seat belts, but these were designed for part of normal operation, not crashes [2].
Cars, on the other hand, are typically yaw only, what we call steering or turning. When cars pitch, this is usually due to a change in the grade of the road and not the driver unless Bullitt is on a high speed chase through San Francisco or Thelma and Louise are driving off a cliff. (Though note the ending freeze frames before the pitch changes to down which is a visually disconcerting angle for a car, as Ridley Scott knew.) Similarly when cars start to roll, the chase is probably over. Cars did not have safety harnesses because they were not required for regular operation, but at the slower speeds compared to flight they could save the driver in a crash.
The first consumer cars were somehow both an incredible design success and a colossal failure, and it took our children's children to work it out. We invented something both economically useful and absurdly dangerous. The same can of course be said about a great number of human technologies, from lead drinking vessels to asbestos, but I keep thinking about that 72 year lag between the invention of the automobile and the modern safety belt.
To state the obvious, humans are maybe not so great at anticipating failure conditions. It is up to designers and engineers to expect these failure states as possible outcomes. But for more systemic analysis in all its complexity, we might be less likely to turn out engines which explode, whether powered by steam or lithium-ion. We eventually thought about cars as if they were not independent of the other drivers, passengers, pedestrians, animals, trees, my mailbox, and parts of my front porch thanks to this guy Dennis. Like the backup driver falling asleep at the wheel of a self-driving taxi, we didn't know the danger we were in.
I wonder sometimes whether we are at a similar place in time as during those 72 years. Even today, cars have been produced for longer without than with modern seat belts and will until 2030, by this measure. And yet, I have a feeling the basic safety apparatus around AI is not yet in place. What are the unanticipated failure modes? What is the seat belt or the antilock brakes we're currently missing for LLMs and other generative AI? For agentic AI on the Internet (or AAII for short, also the sound I make) the current casualities may be executive emails and the reputation of open source developers, but it is only a matter of time before we experience AAII across the whole of the network. I don't think the world is yet prepared for what this means.
December 8, 2025
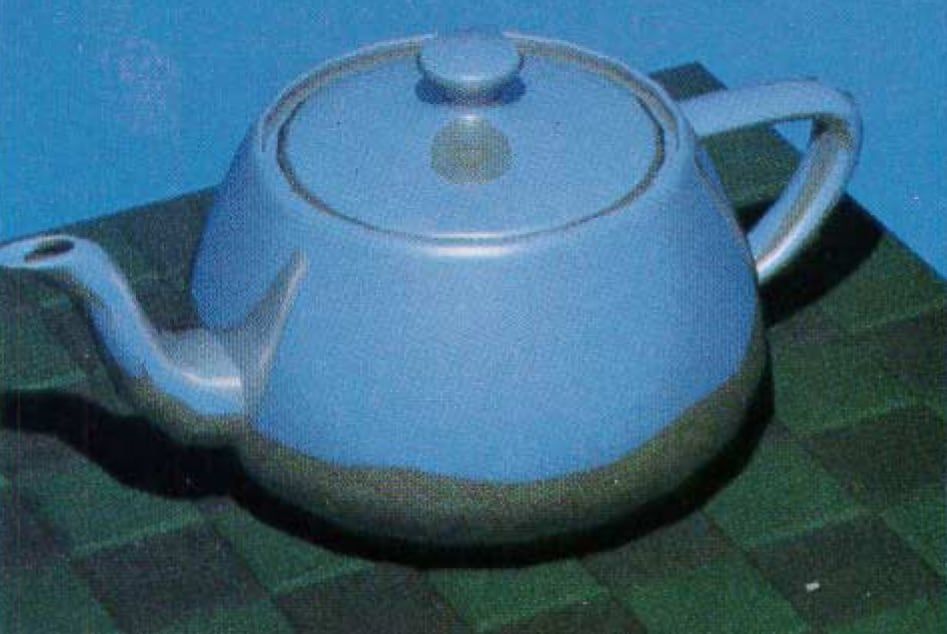
Here are some thoughts on the Hyperlinked Libraries course (at SJSU). I was already on board with participatory design when I began; I had previously worked as a web designer for an academic library where I tried to incorporate patron input through exercises like regular web usability testing, which was really eye-opening. Search is hard to design, and it’s made even harder by navigating link resolvers and database access restrictions.
I’m old enough to remember the early web and the utopian visions of hyperlinked communities challenging power structures, so I was already aligned with much of the course content. What proved more difficult for me was internalizing the ideas around technolust and scaling solutions down to available resources. I tend to think a little too big—what if libraries could band together to make universal open access a reality?—but the truth is that reputation in journals is really valuable.
I want to see libraries be open labs for community, but also have unlimited budgets. It can be difficult for me to scale down my visions, and this course was helpful in that respect. Every technology presents new affordances, but they only matter if they make a difference in the lives of patrons. I’m prone to overestimating the positive impact of technology; my feeling is always there’s a magical design out there somewhere which leverages these affordances to generate absurd value nobody envisioned before, and I want to be on that team. But planning is hard, strategy is hard, and I struggled with the assignments pushing us to commit to those things.
My background is in philosophy, and it’s much easier to critique someone else’s theory than come up with your own. Articulating lofty ideals and writing them down suddenly reveals how little we really know. How will users use this? Will it make sense to them? The only way to find out is to involve them in the design process, but letting that first idea go is hard—it’s obviously the best one, right?—but so often it just doesn’t survive contact with real users. There’s sometimes a disconnect between designers and what library users really need; we tend to want to shake things up for its own sake, increasing cognitive load without addressing user needs. Patrons want us to use the channels they already rely on, even if those are hopelessly passé for a designer. Facebook might not be the new hot thing anymore, but if that’s where we can interact with patrons, then that’s where we should be.
Honestly, it’s hard to let go of those preferences. But it goes back to the design adage: we are not our users. Another shift for me was evaluating AI in the present moment. I’ve been stuck between hype and skepticism, seeing both sides. Sitting down with arguments and evidence made me more critical of AI as a technology—there is real value there, but the downsides are numerous and run deep.
For information science, completing the e-portfolio this semester prompted reflection on an assignment where I used ChatGPT to summarize book descriptions. I was embarrassed in retrospect, even though the professor encouraged exploration. For the inspiration report, I attempted generative AI for images, but found them soulless. At this point, I’m not sure that AI has ever saved me time, despite exploring local models. The evidence falls pretty short of promised value, and academic libraries are in a strange place as universities—including San Jose State—have gone all in on AI.
Ultimately, this course may be about reflecting on value. I’m naturally skeptical of the utilitarian market economist view of value—quantified in dollars or library assessment metrics—but despite that skepticism, I’m prone to adopting it because it is so visible and we are steeped in market ideology. We need something to justify our existence. But this course effectively makes the point that some things really are incommensurable: the joy we bring patrons, the information we provide to help them make difficult decisions, or even providing the next season of their favorite show—these things are ultimately so much more than what shows up in usage statistics.
It was enjoyable chatting and commenting with all of you, seeing your work, and I want to thank everyone for reading my contributions and providing valuable feedback. Thanks, folks.
December 7, 2025
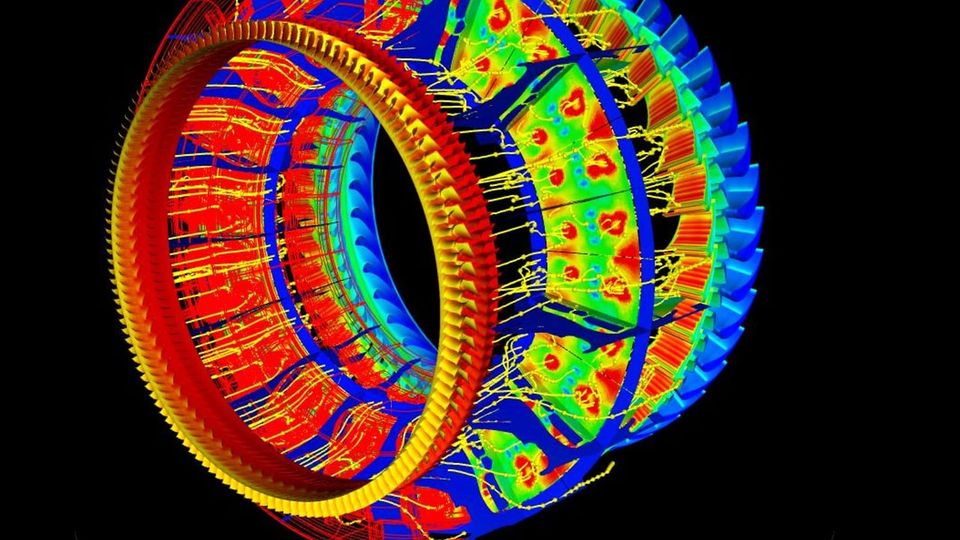
I wanted to put a tin hat on this blog (I have been watching old Doctor Who, sorry) and thought to revisit the Infinite Learning module and professional development experiences. I had two takeaways.
One is that we ought to reflect on that information which we personally have in depth and could be shared with other librarians and information professionals. So, for instance, I know some things about IT, but I am often unsure how much detail people want into how things work. One clue for me is Learning 2.0 participants cited they “better understand IT speak” (Stephens, 2016, p. 135) after training. Perhaps it would be helpful to demystify some of the IT jargon. I wonder what terms are most opaque? Perhaps there are problems with overloaded vocabulary terms where IT and libraries have different ideas about what constitutes a database, for instance? Another clue is that training should focus on “practical implementation of new tools and services” (2016, p. 142).
My other takeaway was the idea to generate a conference report even if nobody asks for one (2019, p. 57). This is part of what the Inspiration Report was for me. I reviewed my notes and presentations from the IDEA Institute on AI in 2024 to prepare the report. The conference was information dense and gave me an overview such that, as above, I could better understand the vocabulary.
The question I am left with now is the same after a conference. How to sustain the momentum? I think ultimately professional learning has to be integrated into daily work. There are times when we need to step back and attend a conference, but I agree we need to cultivate a “culture of learning all year long” (2016, p. 141). Creative outputs, like the Inspiration Report, are also one way to sustain curiosity, provided we are afforded the time. In retrospect, I am grateful to the managers who gave me the opportunity to follow my professional curiosity at work, since I suppose it led me here.
References
Stephens, M. T. (2016). The heart of librarianship: Attentive, positive, and purposeful change. ALA Editions.
Stephens, M. T. (2019). Wholehearted librarianship: Finding hope, inspiration, and balance. ALA Editions.
Image Credits
"2000s Visualization" by NASSA Graphics and Visualization Lab (GVIS)
December 4, 2025
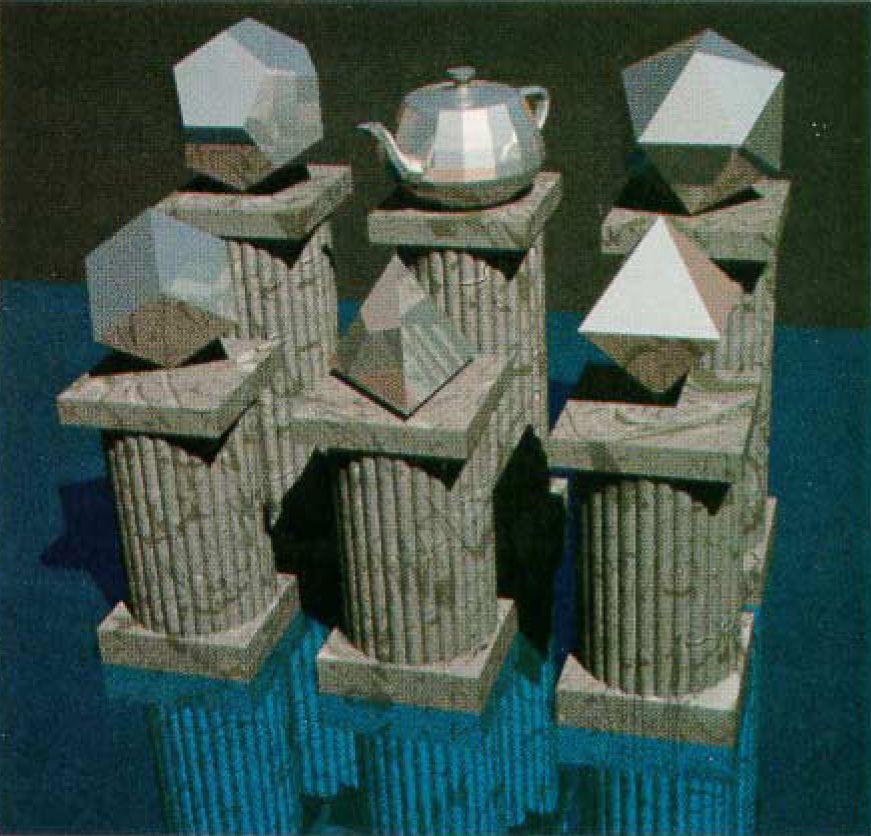
A fun, if impossible, challenge is to imagine how technology will ultimately affect how people interact with information. Douglas Adams famously said that trying to predict the future is a mug’s game, but whether our exact predictions come to pass is not so important as having made them. Drawing a horizon gives us a sense of agency. It allows us to engage in planning even when we know the plans will change by the time we get there.
The NMC Horizon Report (2017) successfully predicted the rise of AI basically on the dot. Their projection was in four to five years and ChatGPT was released in 2022. They also previously listed machine learning, which is what AI currently is without so much gloss. Their observation that, “short term trends often do not have an abundance of concrete evidence pointing to their effectiveness” certainly resonates here at the end of 2025 as the AI bubble is predicted to pop.
The advent of AI for higher education is billed as a way to patch the problems introduced by increasing scale. Remote learning allows schools to admit more students but at the cost of individualized student experience. Learning mangement systems like Blackboard and Canvas are more efficient, but instructors can’t possibly respond meaningfully to an order of magnitude more students. The assembly line experience renders the education more alienating, though perhaps this is inevitable given the nature of online education as less embodied.
Either way, the prospect of AI in education is more individualized attention and reducing the effective student-teacher ratio. (The actual ratio may, paradoxically, increase if fewer instructors are now required for even greater numbers of students.)
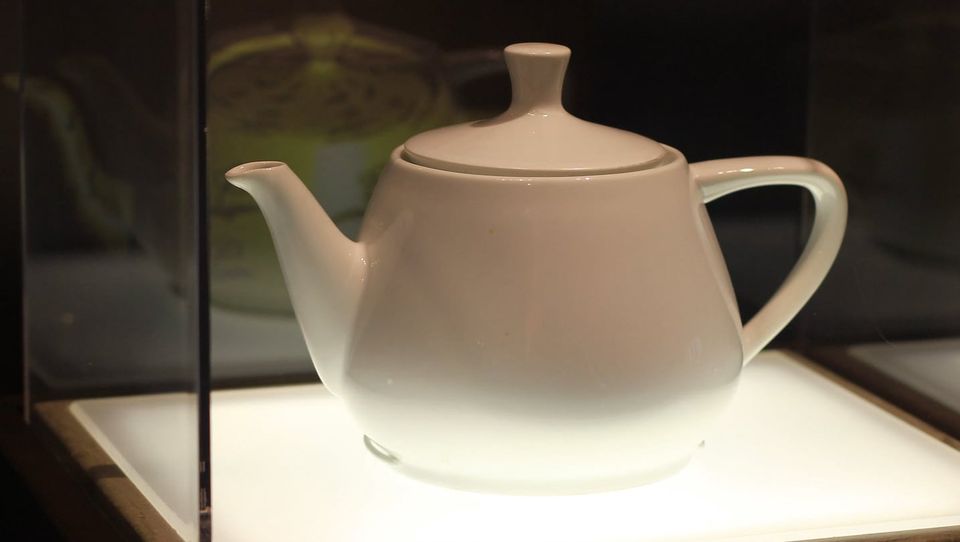
A new technological affordance comes with two questions for librarians and teachers: (1) the general problem everyone faces about how to apply technology to generate value in their field and (2) the additional question of how to teach patrons and students the digital literacy they need to live in a world where that technology now exists. This is true even if they choose not to use it (EDUCAUSE, 2025) on ethical or practical grounds.
In teaching digital literacy around AI, the inability to scale LLMs may actually be a pedagogical feature not a limitation. Desktop or mobile hardware must run simpler models but this allows the experimenter to identify failure cases more easily. Thus students may ultimately better understand the importance of human-in-the-loop and the risk-benefit of using AI if they can more easily see it fail. This makes smaller models arguably better candidates for a learning lab environment. Running the models locally in the library also has privacy benefits for patrons since chats are not shared with technology companies rapacious for data.
References
Adams Becker, S., Cummins, M, Davis, A., Freeman, A., Giesinger Hall, C., Ananthanarayanan, V., Langley, K., & Wolfson, N. (2017). NMC Horizon Report: 2017 Library Edition. The New Media Consortium.
Robert, J., Muscanell, N., McCormack, M., Pelletier, K., Arnold, K., Arbino, N., Young, K., & Reeves, J. (2025). 2025 EDUCAUSE Horizon Report: Teaching and learning edition. EDUCAUSE.
Image Credits
“img_7818” by Michael Hicks, CC BY 2.0
Arvo, J., & Kirk, D. (1987). Fast ray tracing by ray classification. ACM Siggraph Computer Graphics, 21(4), 55-64.
December 2, 2025
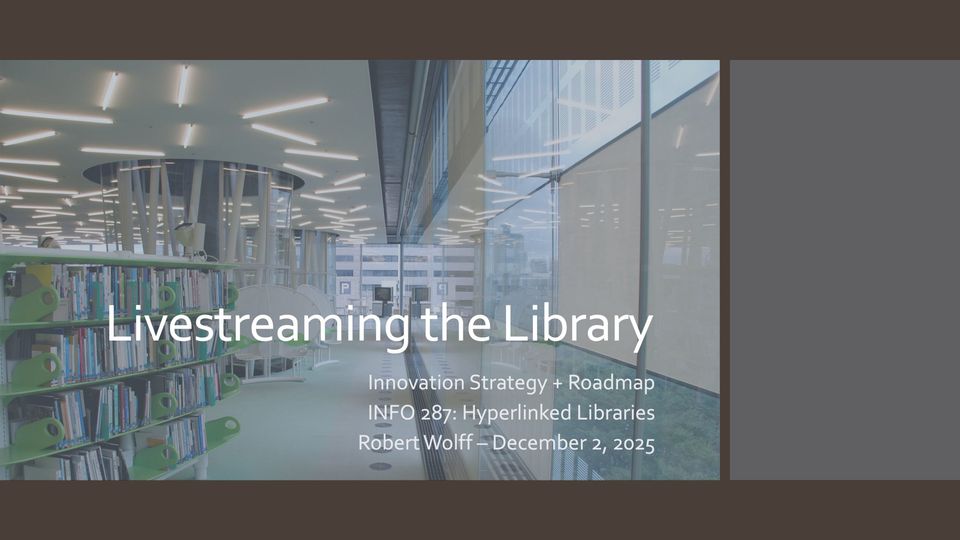
Livestreaming the Library slides
November 23, 2025
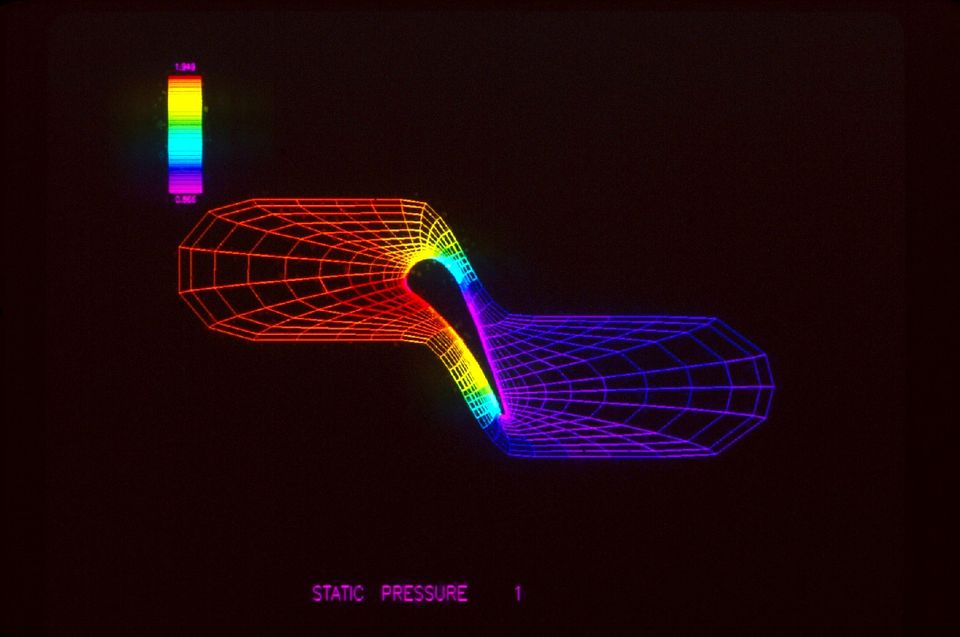
Image credit: NASA
Most users don’t care about sources much of the time; they reach for whatever is at hand. Like Google, Wikipedia, friends and family, maybe a chatbot. Librarians care about the source a lot. We want to show why the source matters and provide access to those sources which provide the best, most relevant information. Users care more about the topic though, the information, the surprise, the finding out.
That’s why I was surprised to learn that first-year students at OSU working on their first research paper often skipped selecting a topic entirely (Deltering & Rempel, 2017). Instead, they chose a topic they already knew well. The decision is a strategic one: with their grade on the line and limited time, the risk in choosing the wrong topic is high. Between their perceived capacity and existing cognitive model of the subject, they choose the topic which minimizes research anxiety, but wind up with a topic for which their curiosity is actually lower.
This aligns with findings that 84% of students say getting started is the hardest part of research (PIL, n.d.). The easiest search is the one you already know how to do, but this reduces their motivation to explore new search strategies, thwarting efforts at information literacy instruction.
The challenge then is to create an environment in which users feel safe enough to explore a topic they are curious about but know very little. What is needed is a way to browse a wider range of high interest topics but with low stakes. The topics must be grounded in existing scholarly discourse so students have something to find. For this, OSU used press releases and news stories from sites like ScienceDaily. They also emphasized framing the exercise as exploring a topic over finding sources per se (Deltering & Rempel, 2017).
This helps students get a sense of what the literature might contain before they formulate a query. This is the paradox of search: you need to know what the index contains and how it is structured before you can effectively query it. Like many complex tasks, you learn along the way what you needed to know at the beginning.
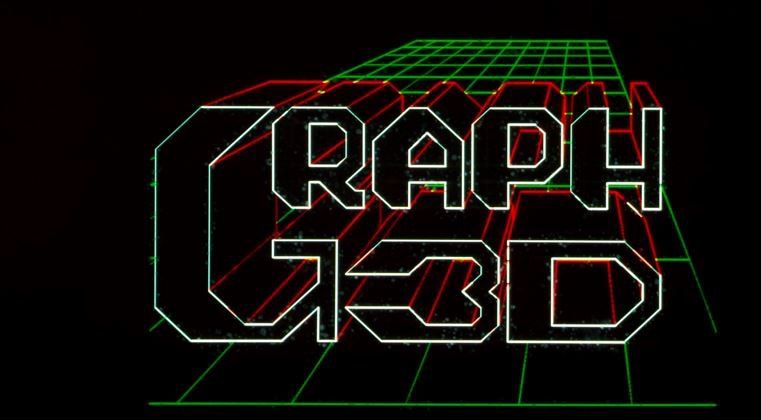
Image credit: NASA
There is a parallel in Matthews essay (2017) on how the organizational structure of academic libraries affects their ability to respond to change. The core argument is that libraries miss important opportunities because they are run too much like factories. If staff had more autonomy and fewer silos, they could better adapt and seize these opportunities.
Though it is hard to quantify, the opportunity cost is potentially quite large. The sense is that new tech-enabled modes of collaboration are such powerful multipliers that a nascent, globally distributed, cross-functional team is out there just waiting to invent the iPod or Taurus sedan of library services. (Are they hiring?)
The problem is the design space is simply enormous. In other words, academic libraries have a similar problem as students doing research; we don’t know what we don’t know, we don’t know which processes are repeatable. The best we can do is experimentation. Perhaps the solution here is similar: a way to explore a wider range of topics but with lower stakes, like allowing staff the (company) time to experiment. This way they can take risks, like first-year students, with less anxiety. Both would benefit from better ways to reward this exploratory research.
References
Deitering, A. & Rempel, H. G. (2017, February 27). Sparking curiosity: Librarians’ role in encouraging exploration. In the Library with the Lead Pipe…. https://www.inthelibrarywiththeleadpipe.org/2017/sparking-curiosity/
Mathews, B. (2017). Cultivating complexity: How I stopped driving the innovation train and started planting seeds in the community garden. http://hdl.handle.net/10919/78886
Project Information Literacy (PIL) (n.d.), A National Study About College Students Research Habits [Infographic], Project Information Literacy Research Institute, https://projectinfolit.org/publications/retrospective#infographics
Image Credits
NASA. 1980s Visualization [image].
NASA. GRAPH3D [image].
Koppitch, A., & Schilling, H. W. (2025, July 23). GVIS lab at NASA Glenn research center history. NASA. https://www.nasa.gov/centers-and-facilities/glenn/gvis-history-glenn/
October 28, 2025
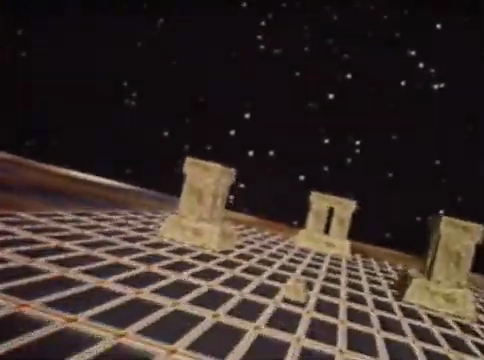
Still from a simple computer animation by David Em for NASA JPL
I struggled at first with how the ideas from these readings related to one another until I realized that communities are mesoscopic. Their unit of abstraction is somewhere in the middle. I think I’m more comfortable at the micro or macroscopic, like a mental model and user interface or else big ideas like information, humanity, or economy.
Everything in the middle is a bit messier, maybe because there isn’t a limit of abstraction to hem it in. It requires both analysis and synthesis. Communities overlap in physical and virtual space; they are continuously changing over time; and people are members of multiple communities simultaneously.
How the library operates at this scale is less immediately clear. Individual user experience (UX) can be assessed and improved, but what does it mean to design for community experience (CX)? Does it make sense to talk in these terms? I think it does, and the readings reinforced that, even if people interact with the library as individuals with unique needs and interests.
Design begins and ends with users and outcomes. This topic nudged me to think about how libraries might address communities’ needs just as we do at user-scale. The first takeaway for me was about community research and outreach. How do we find out more about the communities that use the library most and keep them? How do we reach new constituencies we underserve? And as learn more, how do we foster new forms of community in physical and virtual library spaces?
The answer to these questions are projects like salon-style community conversation, online story-telling platforms, or even just a simple community bulletin board which happens to be mobile (Dixon, 2017). I also appreciated the idea of turning over programming to community groups, if you can get the grant funds to pay them, that is (Smith, 2017). I felt that Ciara Eastell correctly identified austerity as the problem here. This is what lurks behind the constant need to “do more with less.”
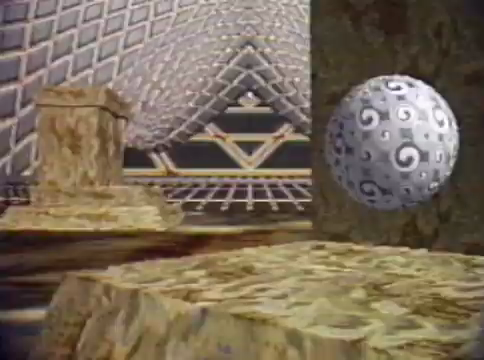
Still from a simple computer animation by David Em for NASA JPL
Resource Allocation & Value
No one service or system will meet the needs of every individual. We need to develop an economic model for the allocation of resources for the various modes of user engagement based on the specific user groups’ needs and expectations (Connaway, p. 204).
This was the other big question for me. How do we draft budgets, those mesoscopic counterparts, to allocate resources for the communities we serve? Pewhairangi framed this as focusing on those patrons who generate the most value for the library. But this is backwards, is it not? Generally, we talk about how libraries produce value for communities, not the other way around. This is market logic as applied to libraries, i.e., focus on your core niche of high-value customers. I admit I chafed at this a little. The term “customer intimacy” has a decidedly negative connotation in an era of surveillance capitalism.
But I get the logic. Focus on those who generate most of the usage. Let’s set aside the thorny question of how to quantify this, e.g., how many circulations equal an event attendance or a reference transaction. My concern was it runs headlong into patron privacy. This was articulated by danah boyd (one of my favorites): “Sometimes, it’s not the data that’s disturbing, but how it’s used and by whom” (2016).
People trust the library. Our credibility depends on being responsible stewards of patron and community data. Useful though it is, users must be well informed about the nature of that data collection (particularly if they are already highly surveilled) and accountability must be built in, as boyd suggests.
References
boyd, d. (2016). What world are we building? Points. Data & Society Research Institute. https://medium.com/datasociety-points/what-world-are-we-building-9978495dd9ad
Connaway, L. S. (2015). Meeting the expectations of the community: The engagement-centered library. The Library in the Life of the User: Engaging with People Where They Live and Learn. OCLC. https://www.oclc.org/research/publications/2015/oclcresearch-library-in-life-of-user.html
Dixon, J. A. (2017, October 17). Convening community conversations. Library Journal.
Eastell, C. (2019). How libraries change lives. YouTube. https://www.youtube.com/watch?v=Tvt-lHZBUwU
Pewhairangi, S. (2014, May). A beautiful obsession. Weve. Heroes Mingle. https://heroesmingle.wordpress.com
Image Credits
Em, D. (2025). David Em Film Sketches (1975-1983). YouTube. https://www.youtube.com/watch?v=w2kjhMqlZfU
September 24, 2025
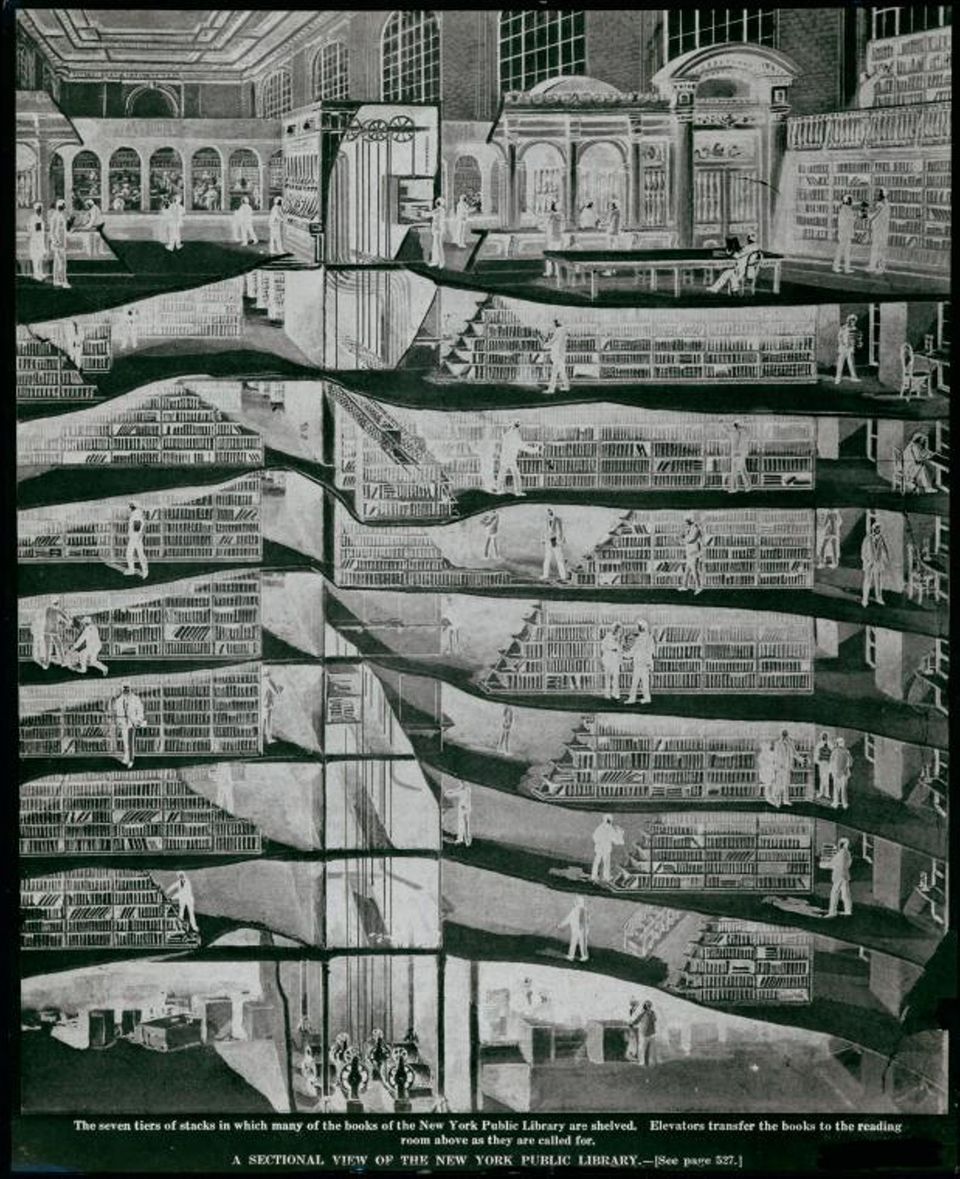
Participatory service is an essential part of the hyperlinked library. With new possibilities for engaging with library users, we can better include them in both the development of new services and in the structure of the services themselves. That is, participatory service can be understood in two ways: (1) users participate in the design process and (2) the services themselves are designed to be participatory. (In principle, it is possible to have one without the other, but designing services to be participatory without somehow involving users seems ill-fated.)
Examples of soliciting user feedback abound: advisory groups, suggestions boxes, patron surveys, asking on social media, informal feedback during service interactions. These are rich sources of information about user needs and the kinds of services they might use. We can also bring users in as stakeholders to the service creation process through participatory design. The difficulty here is users do not always know what they want. “We can’t solve the mystery of the future of libraries by asking users what they want: they simply don’t know!” (Denning, 2015).
It is, of course, not their job to know; it’s ours. The common design adage is that users are poor designers but excellent refiners. Naively asking users to design new services is often inadequate given the complexity of the problem we are trying to solve. Their input is probably more helpful when reviewing an existing service or a new proposal. Inviting them to participate in the design process however is still enormously helpful! It provides insight into their holistic needs and mental models. Our challenge is to meet the needs which they, and we, have not thought of yet.
(Of course, sometimes we can just implement user suggestions. If they ask for an extra stapler near the printer, just put another stapler there.)
Participatory service is more than user input, however. The second sense is in the design of the services themselves. Information flows many ways now, and patrons want to tell their own stories. So, at DOK Delft, patrons can add, tag, and describe their own photos on a touchscreen table (Boekesteijn, 2011). Another example is patron-driven acquisition. “Letting the public have a role in ordering materials is one way to open a library’s collection to its readers” (Kenney, 2014). The US National Archives provides web users the opportunity to participate in collection processing by transcribing historical records and manuscripts (2025). In each of these cases, user participation is at the core of the design.
Beyond these two meanings of participatory library services, Michael Casey (2011) suggests a possible third. Quoting Tim O’Reilly:
“How do we get beyond the idea that participation means ‘public input’…and over to the idea that it means government building frameworks that enable people to build new services of their own?”
This understanding of participatory service might be expressed yet another way: (3) users can design services for themselves and one another.
This adds another level of abstraction. We can solicit user input on our participatory services, but we can also build platforms for users to create their own applications. Customizing and personalizing user interfaces is one example. Another is providing and documenting application programming interfaces (APIs) for digital collections and catalogs. This would require their knowing how to code however, excluding many users. We might imagine interfaces where users could mash-up library collections with other data sources. There was a trend during the mid-2000s for just this kind of application, e.g., Yahoo Pipes.
Note, however, that the complexity of the design challenge grows. This is not like making a web form or a multiplayer game; this is more like creating a game engine for users to make their own games.
I made a video game once. It was the hardest thing I’d ever done. I thought then that game design was the ultimate design challenge. I’m not sure now that libraries don’t actually hold this title. The prospect is daunting: designing the basic building blocks for users to create their own participatory information experiences. Nonetheless, this third kind of participatory service may help us fully realize the hyperlinked library as we move from user input to user participation and finally to user empowerment.
References
Boekesteijn, E. (2011). DOK Delft takes user generated content to the next level. Tame the Web. http://tametheweb.com/2011/02/15/dok-delft-takes-user-generated-content-to-the-next-level-a-ttw-guest-post-by-erik-boekesteijn/
Casey, M. (2011). Revisiting participatory service in trying times. Tame the Web. http://tametheweb.com/2011/10/20/revisiting-participatory-service-in-trying-times-a-ttw-guest-post-by-michael-casey/
Denning, S. (2015, April 28). Do we need libraries? Forbes. http://www.forbes.com/sites/stevedenning/2015/04/28/do-we-need-libraries/
Kenney, B. (2014). The user is (still) not broken. Publishers Weekly. http://www.publishersweekly.com/pw/by-topic/industry-news/libraries/article/60780-the-user-is-still-not-broken.html
Manuscripts and Archives Division, The New York Public Library. (1897 - 1911). Sectional view of the seven tiers of stacks. https://digitalcollections.nypl.org/items/26bfa330-c5b6-012f-4b03-58d385a7bc34
National Archives. (2025, September 22). Citizen archivist missions. https://www.archives.gov/citizen-archivist/missions
August 7, 2024
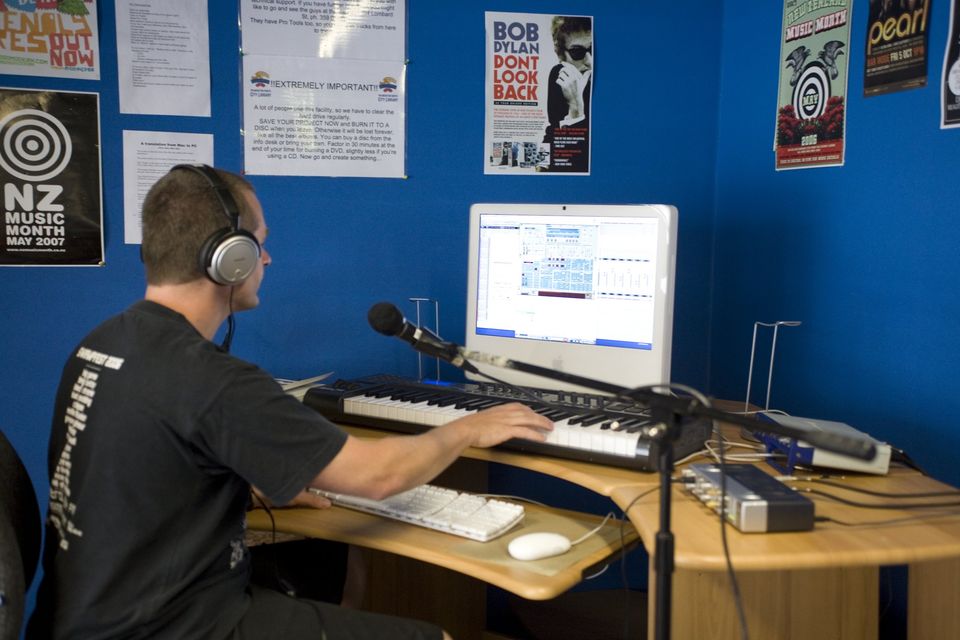
Image credit: Beat Booth by Living Room of the City, 2009, Flickr. (https://flic.kr/p/68w8sW) CC BY-NC 2.0 Selecting and preparing your recording space has a significant impact on the quality of your presentational audio.
Background Noise
This is any unwanted sound present in your recording space. It could be people nearby, pets, weather like wind or rain, traffic, fans, heating, or air conditioning. These can all reduce the clarity of your audio content.
Measurement
You can measure the amount of background—or any other—noise in your environment using a sound level meter app (iOS-only) from the US National Institute for Occupational Safety and Health (NIOSH). It was designed to help protect workers from hearing loss while on the job, but you can also use it to generate an objective, real-time measurement of the current background noise.
Activity
Take a moment now to close your eyes and listen for as many background sounds as you can. Perhaps you can hear appliances whirring in the next room, neighbors mowing their lawns, or emergency vehicles on a nearby road. Any of these could potentially show up in your recording. Write down as many ambient noises as you hear. Try repeating this exercise in each of your possible recording spaces or with doors and windows closed.
Room Acoustics
Acoustics are a product of the physical characteristics which affect sound waves in your space. There are many nuances which can affect the quality of your audio, but an important one is reverberation. If your space is large with many hard, symmetrical surfaces, this can lead to reflected echoes, making your words less intelligible. However, the opposite can also be troublesome:
Recording studios usually contain a mixture of hard surfaces such as wood and soft surfaces such as carpet. The mix of hard and soft surfaces will create a balance between the room sounding too live and too dead…. Another popular piece of advice for podcasters is that they should record in their closet… [but] the closet has too many soft surfaces in the form of your clothes. These soft surfaces absorb too much of the high-frequency sounds, making speech sound muffled or dead (Green, 2021, p. 122)
The ideal space is one which is not too big or small with a variety of hard and soft materials (p. 125).
Preparing the Recording Space
If your space is overly reverberant, use soft materials such as area rugs, blankets, pillows, and drapes to help prevent bouncing sound waves. This also helps soundproof the room from unwanted background noise.
In addition, close any doors and windows which allow in any unwanted sound. Roll up a towel and place it in the gap under the door. Turn off any fans, air conditioners, or unneeded appliances. You can also record at times when your environment is quieter, such as at night.
Selecting a Space
The best space in which to record may be your local library. Many libraries now offer dedicated recording spaces for musicians and podcasters. This also saves you the trouble and cost of purchasing dedicated audio equipment.
If you can find such a facility, I would highly recommend using it, because this will give you the best value for money. The council or library generally provides training for the use of their equipment (Green, 2021, p. 115).
Some even allow you to book time with an audio engineer, such as at the Spokane Public Library.
Using the measurement app above and trial recordings, try comparing the qualities of each of the candidate recording spaces in your home, office, or local library.
Library Recording Studios
Here are some examples of libraries which provide recording spaces:
References
Green, C. M. (2021). Recording Inside. In The Podcaster’s Audio Handbook (pp. 113–128). Apress. https://doi.org/10.1007/978-1-4842-7361-6_5
December 6, 2023
In retrospect, this semester, I have learned so much about the diverse communities on the frontlines of climate change and how they engage in information seeking and sharing.
I have also, quite unexpectedly, become more aware of my own heuristic versus systematic processing, some of the cues I use as shortcuts to understanding, and insight into my own biases. I keep returning to Bates's notion of an invisible substrate to information science, which I think of as an epistemological unknown-known. It is becoming aware of the water we swim in, and I am still adjusting to the shift in perspective.
I learned about practical tools and methods in academic writing. This was the first time I made extensive use of a citation manager, in this case, Zotero. It motivates me to explore other citations managers to see what features might better streamline the writing process. Simply as an organizational matter, authors with similar names who publish multiple articles per year on the same topic can become a bit unwieldy.
This was my first use of a matrix for literature reviews, which proved to be immensely helpful. The Risk Information and Processing (RISP) model is a bit complex, so being able to summarize which features were tested in each paper was essential. Little did I know when I started INFO 200 that I would be doing a deep dive into psychological models for health and environmental risk communicators.
It's also given me a new appreciation for libraries, their role in the local community, and the multitude of opportunities we have to engage, from supporting the gathering of local environmental data to participatory mapping to helping people navigate bureaucracy in order to meet their needs.
While I am still getting comfortable with blogging as a medium, it was a delight to read my fellow students' work over the semester as they researched their information communities. They are so varied and fascinating!
November 19, 2023
One emerging technology in use by communities on the frontlines of climate change is participatory mapping. Using mobile devices with GPS and text messaging, people in areas without formalized public transit are increasingly invited to contribute to the mapping of local service and travel routes.
Urban planning has used participatory maps since the 1930s. Today, these maps "show the community back to itself, revealing hot spots of local corruption and pollution, giving activists the tools to target particular places with investigation or protest" (Guldi, 2017, p. 98).
For this post, I've created a map using OpenStreetMap and Leaflet.js. (WordPress does not have an Embed block for OpenStreetMap, so I've linked to a self-hosted site below the screenshot.)
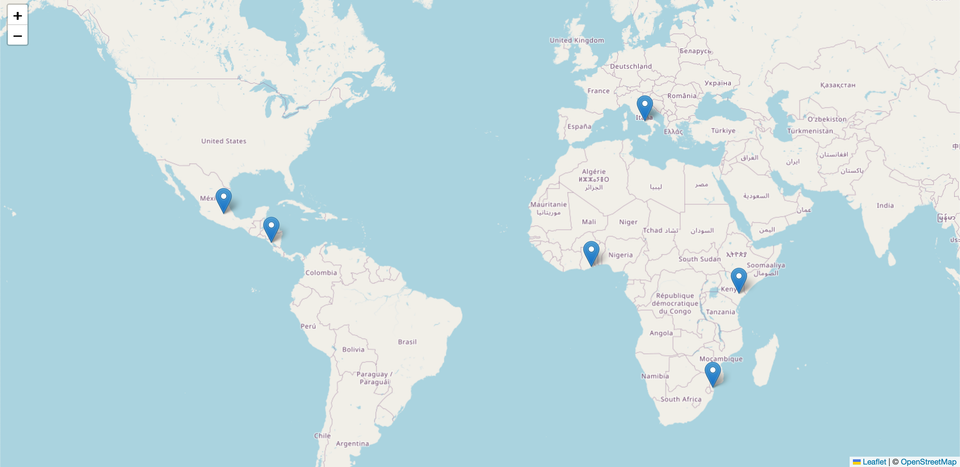
See the full map Each marker on the map provides a brief description and a link to the map for projects in the following places:
- Accra, Ghana
- Managua, Nicaragua
- Maputo, Mozambique
- Mexico City, Mexico
- Naples, Italy
- Tana River, Kenya
References
Chapas Project. (2018, February 20). Calendário 2018 com o mapa. https://chapasproject.wordpress.com/2018/02/20/calendario-2018-com-o-mapa/
Guldi, J. (2017). A history of the participatory map. Public Culture, 29(1), 79–112. https://doi.org/10.1215/08992363-3644409
Lehuby, N. (2019, June 26). Retour sur la cartographie d’Accra. Jungle Bus. https://junglebus.io/retour-sur-la-cartographie-daccra/
MapaNica. (n.d.). Rutas de Managua y Ciudad Sandino. https://rutas.mapanica.net
Mapatón CDMX. (2016, January 20). Home page. https://web.archive.org/web/20160120221654/http://www.mapatoncd.mx/
Ushahidi. (2022). Mappa interattiva del biciplan—piano urbano della mobilità ciclistica della città metropolitana di Napoli. https://mappabici-cmna.ushahidi.io/map
Ushahidi. (2022). Tana river climate change & livelihoods restoration project. https://tclirp.ushahidi.io/map
November 12, 2023
The International Federation of Library Associations and Institutions (IFLA) predicted a rise in issue-focused constituencies—like those concerned about climate change—over traditional political partisanship back in 2013. Their optimistic view is that open government leads to greater access to data, which in turn makes government more responsive to the needs of the people.
What then are the barriers to greater international cooperation between governments, institutions, and the people most affected by climate change? One of the answers is bureaucracy. Indeed, the IFLA aspires to be, “less bureaucratic, inflexible and resistant to change” in their 2018 Global Vision Report.
A related hurdle at the international level is intellectual property law. Climate change threatens the loss of culturally important collections due to sea-level rise, weather events, fire, and political disruption. One of the basic methods of preservation, copying, is often restricted by national and international intellectual property restrictions and copyright law. Yet, “no countries have laws which allow heritage institutions to work on a truly global scale to form preservation networks” (IFLA, 2020). They urge members of the World Intellectual Property Organization (WIPO), an agency of the UN, to support copyright laws which enable preservation at a global scale.
The IFLA also works to help recognize and preserve these collections through their Risk Register. Whether they are local or international, institutions can register at-risk collections with IFLA to, “equip practitioners with tools to manage risk, while cataloguing critical information” (IFLA, n.d.). It also helps share information across institutions and, ideally, bring network support and resources to a critical problem.
Another significant barrier is sexism. Women and girls are disproportionately affected by climate change. The UN, for instance, estimates they make up 80% of climate refugees. Women in less industrialized countries are often responsible for collecting water, food, and fuel and must travel further when these needs cannot be met locally (UN, 2021). These effects are exacerbated by persistent gender inequality and lack of political power.
References
International Federation of Library Associations and Institutions (IFLA). (n.d.). About the IFLA risk register. https://www.ifla.org/about-the-ifla-risk-register/
IFLA. (2013 August). Riding the waves or caught in the tide? Insights from the IFLA trend report. https://trends.ifla.org/insights-document
IFLA. (2018 March). Global vision report summary: Top 10 highlights and opportunities. https://repository.ifla.org/handle/123456789/296
IFLA. (2020 April 26). Heritage cannot wait in the face of climate change. https://www.ifla.org/news/heritage-cannot-wait-in-the-face-of-climate-change-ifla-welcomes-signatures-to-open-letter-on-world-ip-day/
United Nations (UN). (2021 November 9). Women bear the brunt of the climate crisis, COP26 highlights. UN News. https://news.un.org/en/story/2021/11/1105322
November 5, 2023
Libraries can and do provide learning and programming opportunities for people who are at-risk from the effects of climate change. Information technology affords new opportunities for the experiences of communities on the frontline of climate change to be heard. However, they must have access to the means of creating content and the training to make effective use of them.
Pedagogy has embraced new modes of learning, such as creating videos, web sites, conducting interviews, and creating physical objects. More specialized services such as data visualization and geographical information systems (GIS) are also increasingly available (Lippincott, 2015). These latter services are particularly useful to documenting the local effects of climate change and other natural hazards (McNutt & Goldkind, 2015, p. 6413). Better funded public libraries may have training for these available. Academic libraries often make these available to the wider public as well.
Other opportunities for teaching and learning abound. For communities monitoring local air and water quality with “cheap sensors paired with cellphones,” libraries could be the ones to provide and host training to build and integrate these devices into local practice (Guldi, 2021, p. 10). They could also create spaces to store and present this data both physically and virtually. Libraries are a key environment for pedagogy, and environment is one of four key factors for learning according to Booth (2011). It includes the physical comforts of an educational space, but also attention to, “cultural elements such as language accessibility and inclusiveness” (p. 45).
However, there are impediments to providing more innovative library programming. Stephens warns of “bureaucratic barriers,” noting that libraries require “inspired and insightful management” to be successful (2014). Leadership—deans, directors, and trustees—must be willing to investigate the needs of their patrons and experiment with innovative learning and programming for them. This requires the vision to adopt new modes of teaching, inclusivity for those who are already typically marginalized, and the daring and willingness to fail.
References
Booth, C. (2011). Reflective teaching, effective learning: Instructional literacy for library educators. American Library Association.
Guldi, J. (2021). What kind of information does the era of climate change require? Climatic Change, 169(1–2), 3. https://doi.org/10.1007/s10584-021-03243-5
Lippincott, J. (2015). The future for teaching and learning. American Libraries, 46, 3–4. https://americanlibrariesmagazine.org/2015/02/26/the-future-for-teaching-and-learning/
McNutt, J. G., & Goldkind, L. (2015). E-activism. In M. Khosrow-Pour, D.B.A. (Ed.), Encyclopedia of Information Science and Technology (3rd ed., pp. 6411–6418). IGI Global. https://doi.org/10.4018/978-1-4666-5888-2.ch629
Stephens, M. (2014). Library as classroom. _Library Journal, (139)_9. https://www.libraryjournal.com/story/library-as-classroom-office-hours
September 30, 2023
Today we review the paper titled, I Share, Therefore I Am: A U.S.−China Comparison of College Students’ Motivations to Share Information About Climate Change by Yang, Kahlor, and Griffin (2014).
I Share, Therefore I Am examines the motivations behind information sharing among undergraduate students at four universities, two each in the US and China. The authors investigate the importance of several factors, including social norms, information insufficiency, and risk perceptions including its importance (p. 115–117). These factors can be found in the Risk Information Seeking and Processing (RISP) model. The current study also considers the relationship between information seeking and sharing (p. 119).
The authors of the paper are Z. Janet Yang, Lee Ann Kahlor, and Darrin J. Griffin.
Z. Janet Yang is a Professor of Communications at SUNY Buffalo. She writes about risk information seeking behavior around health and environmental threats like climate change, natural disasters, and disease outbreaks. Yang has a Ph.D. in Communications from Cornell University.
Lee Ann Kahlor is a Professor in the School of Advertising and Public Relations at UT Austin. She also studies risk information behavior and developed the PRISM model used in other studies (Kahlor, 2010). She has written on topics such as television and gender violence, science and health communication, and their relationship to cultural diversity. Kahlor has a Ph.D. in Mass Communication from University of Wisconsin-Madison and edits the journal, Science Communication.
Darrin J. Griffin is an Associate Professor of Communications and Director of the Communication and Applied Theory Research Laboratory at the University of Alabama. He writes on education, deaf culture, and deception in communication. He has a Ph.D. in Communications from SUNY Buffalo.
The study gathered 1,381 responses in spring, 2011. In addition to the factors listed above, the survey captured age, gender, ethnicity, and income. Their examples of climate-related risks included disease outbreaks and threats to clean water. The survey also asked about information source usage, such as news media, governments, environmental groups, scientists, power companies, and family and friends (p. 122–123).
The study found information sharing was correlated with:
- Social norms
- Information seeking
- More current knowledge among American students, but only among those with higher confidence in their knowledge level
- Less current knowledge among Chinese students
- Negative feelings like worry (but not rational assessment of climate risk)
- Underrepresented ethnic groups, but only in the US (p. 124–126)
Of these, social norms and information seeking had the strongest relationship with sharing. That is, people who felt expected to be informed about climate change and perceived others as knowledgeable were more likely to engage in sharing (or at least indicate they would on a survey).
While both rational risk assessment and negative emotion affected sharing, the latter had more impact in the US than in China. The authors suggest this may be due to the impersonal nature of climate risk and also cultural differences (p. 128).
They conclude with some practical advice, such as leveraging social norms and emotional activation to encourage social sharing about climate change (p. 130). This might look something like, “Your friends are informed about the climate crisis and think you should be too.”
The motivation for studying climate risk information behavior is to help health and science communicators better motivate the public to action. Empirical testing of the RISP model has typically assumed the flow of information is one-way. An individual can encounter information about climate change and might be motivated to seek more, but in either case they are they are not considered a source of information:
Beyond information sharing through hierarchical structures from the sources to the receivers, when information sharing occurs in recursive directions… it can contribute to information exchange, which can subsequently lead to more optimized distribution of resources… or a more informed public (italics original, p. 114).
This paper raises the prospect that we might have something to learn about climate change from one another, not just directly from experts. Even further, it suggests the possibility that experts might have something to learn from the experience of people directly affected by a changing climate.
References
Kahlor, L. (2010). PRISM: A planned risk information seeking model. Health Communication, 25(4), 345–356. https://doi.org/10.1080/10410231003775172
Yang, Z. J., Kahlor, L. A., & Griffin, D. J. (2014). I share, therefore I am: A US−China comparison of college students’ motivations to share information about climate change. Human Communication Research, 40(1), 112–135. https://doi.org/10.1111/hcre.12018
September 17, 2023
The information community I chose is those people facing the reality of climate change. It is composed of communities most impacted by climate change, the groups that advocate for them, and the producers of relevant climate information, e.g., scientists and science communicators.
One of the models which applies to the information needs and behavior of this community is Risk Information Seeking and Processing (RISP), developed by Griffin, Dunwoody, and Neuwirth (1999). It models risk information seeking by considering a set of key variables, including how the individual perceives a particular hazard, their affective response (dread, worry), and their community’s expectations around being well-informed.
To the extent the individual perceives an information gap, they will seek out relevant information based on how they regard various media channels. They also consider their own information gathering capabilities, such as how easily the information can be found and understood (Griffin, et al, p. S232).
The RISP model has been applied in a variety of contexts, including information seeking around personal health and environmental risks. RISP borrows elements from prior models including the Theory of Planned Behavior (TPB) and Heuristic-Systematic Model (HSM). From TPB it takes the concepts of norms and perceived behavior control. From HSM it takes the ideas of heuristic and systematic information processing and the sufficiency principle (Kahlor, 2007, p. 417–419).
The distinction between heuristic and systematic information processing is the latter requires more cognitive effort and resources. The sufficiency principle says people will expend this effort to gain sufficient confidence they have closed their perceived knowledge gap and this, "motivates a person to devote more cognitive effort to processing messages about the behavior, e.g., evaluating the message critically, thinking about the message, integrating message- based information with what one already knows" (Griffin, et al, p. S237).
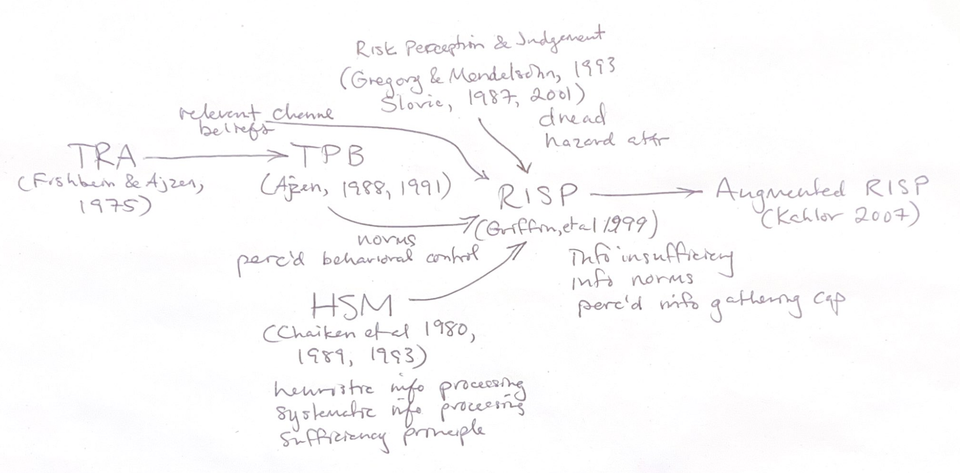
A diagram showing some of the influences on the RISP model. Click for full version.
Kahlor (2007) further develops this model, which she calls augmented RISP. She retains some core elements, but draws upon additional concepts from TPB. For instance, she considers the individual’s attitude toward the information seeking behavior itself, such as whether it is effective and the subjective experience of searching. She also adds a component prior to the actual seeking behavior, which is the intent to seek (p. 419).
She goes on to describe results from empirical testing of the model using an online survey of 828 respondents. She concludes that the perceived importance of climate risk and its personal health impact increases the feeling of worry. This worry, along with others’ expectations for being informed, in turn increases the perceived information gap. The greater the gap, the more likely they are to express an intent to seek information (p. 429–430). A relationship between intent and actual information seeking behavior, however, is left for a future study.
These models, Kahlor shows, are effective at predicting some variance in risk information seeking intent. However, every map leaves something out, otherwise it would be the territory. One modification she makes is the collapsing of per channel beliefs in RISP to a more general consideration of individual attitudes towards information seeking (p. 420). In a world where the Internet affords so much information seeking, considering attitudes towards different channels would seem worthwhile. After all, where the individual seeks information from is as important as the fact of them seeking information at all, especially given the proliferation of misinformation on such a highly politicized topic as climate change. Perhaps this feature re-appears in future models.
References
Griffin, R. J., Dunwoody, S., & Neuwirth, K. (1999). Proposed model of the relationship of risk information seeking and processing to the development of preventive behaviors. Environmental Research, 80(2), S230–S245. https://doi.org/10.1006/enrs.1998.3940
Kahlor, L. A. (2007). An augmented risk information seeking model: The case of global warming. Media Psychology, 10(3), 414–435. https://doi.org/10.1080/15213260701532971
September 3, 2023
Information communities, now a foundational course, was an emerging term in 2001, according to Joan Durrance. This focus for librarianship, she says, comes out of best practices for those who must demonstrate their impact and thus justify their work (and funding). She observed two decades ago that accelerating information technology and connectivity was leading to, “an increasingly fragmented information base, a large component of which is available only to people with money or acceptable institutional affiliations.”
If only we knew what was to come. When she wrote this, atmospheric carbon dioxide was about 371 ppm. Today that number is closer to 421 ppm (NOAA, 2023). Likewise, mis- and disinformation proliferates on the Internet. Reliable information is locked behind paywalls while fact-free screeds roam free.
Durrance defines information communities as a partnership of institutions and individuals, “constituencies united by a common interest in building and providing access to a set of dynamic, linked, and varying information resources” (2001). Fisher and Fulton (2022) further develop this notion with five key characteristics: (1) collaboration among a variety of information providers, (2) formation around information needs, (3) utilization of new technologies, (4) overcoming of barriers, and (5) fostering social connections.
The information community I would study centers around those engaged with the reality of climate change. In particular, I would focus on the relationship of climate scientists with affected communities and the organizations that advocate for them. For instance, how does the scientific community produce knowledge and communicate among themselves versus a wider audience? How do environmental groups and lay audiences make sense of the science? How do climate activists use and transform this knowledge to best affect policy change?
Relatedly, how can information science help us engage with the knowledges of those affected communities as well? As the field develops new, critical approaches to studying information-seeking behavior, we have an opportunity to help empower communities as they actively participate in solving the local problems of a changing climate (Du, Chu, and Partridge, 2023).
Collaboration Among Diverse Information Providers
Studying the climate is inherently multi- and interdisciplinary. Building knowledge about a system so complex requires communication among a variety of scientists: atmospheric chemists, oceanographers, geophysicists, meteorologists, glaciologists, and so on. How do these groups exchange information across knowledge silos? What are the controlled vocabularies and data standards in use to avoid overloading common terms with different meanings in disparate domains?
A wide variety of professional organizations, government agencies, educational institutions, scholarly publishers, and science communicators disseminate information among the scientific community and to the public. This happens online in a variety of modes both formal—academic journals or conference proceedings—and informal—social media or email listservs. Nonetheless, these institutions and individuals must work together to share needed information.
Community Information Needs
The type of information required by each role within the climate advocacy community depends in part on their scientific information literacy. Scientists speak one language, but the public speaks another, and policy makers still another. How do members of the scientific community produce the information products required for each audience? How to community organizations help translate this knowledge for their own use? Each constituency has need of similar information but at different levels of granularity.
Use of Emerging Technologies
Scientific communication has long made use of new and emerging technologies for the production and exchange of information. The world-wide web itself was created in support of physicists at CERN. As noted above, the proliferation of information technology has enabled instant access to weather and climate data but also echo chambers immune to evidence. Coordination among environmental and community groups also occurs on the Internet and locally, but these locations are likely separate from the scientific discourse. It is up to individuals and institutions to bridge this gap.
Overcoming Obstacles to Sharing Information
In 2009, emails exchanged between climate scientists at East Anglia University were leaked to the Internet. This event was known colloquially as “Climategate.” Climate deniers seized upon the emails as evidence of a scientific conspiracy (Hickman and Randerson, 2009).
I am curious to know how the climate science community responded. Did it affect their relationship with the public? How did their modes of communication change? Did the venue for information exchange shift? Place is essential to the framework for information grounds (Fisher and Fulton, 2022). This place was disrupted by revealing internal discourse divorced from its original context.
Social Connectedness
Effective advocacy for facing the reality of climate change requires interaction and collaboration between scientists, science communicators, and environmental justice advocates. In order to speak with one voice to policy makers, they need a shared vocabulary and worldview informed by science. Ultimately, what brings these people together is a shared goal of preventing the worst consequences of a warming planet.
References
Du, J. T., Chu, C.M., & Partridge, H. (2023, January 4). A critical approach to engaging communities in information behavior research. _Information Matters, (3)_1. https://informationmatters.org/2022/12/a-critical-approach-to-engaging-communities-in-information-behavior-research/
Durrance, J. (2001). The vital role of librarians in creating information communities: Strategies for success. _Library Administration & Management (15)_3.
Fisher, K. E., & Fulton, C. (2022). Information communities. In Hirsh, S. (Ed.). Information services today: An introduction (pp. 41–52). Rowman & Littlefield.
Hickman, L., & Randerson, J. (2009, November 20). Climate sceptics claim leaked emails are evidence of collusion among scientists. The Guardian. https://www.theguardian.com/environment/2009/nov/20/climate-sceptics-hackers-leaked-emails
National Oceanic and Atmospheric Administration. (2023, September). Global Monthly Mean CO2. US Department of Commerce. https://gml.noaa.gov/ccgg/trends/global.html


