Carbon (CO2)
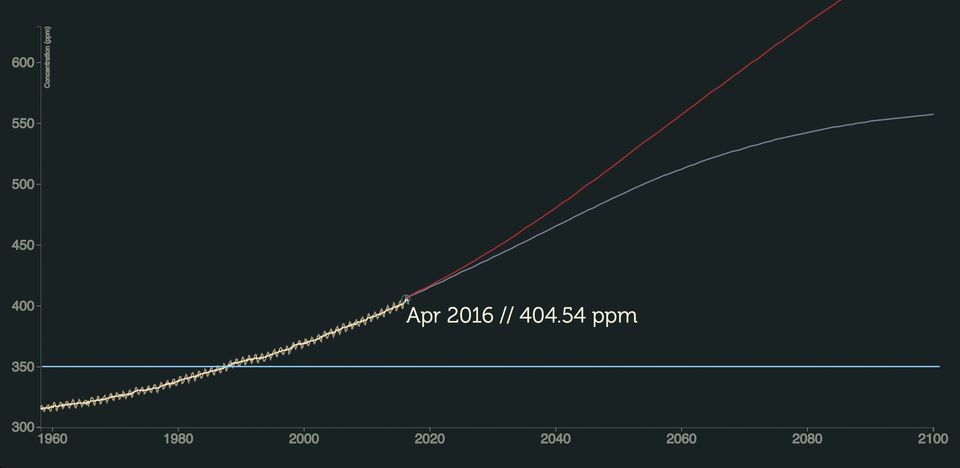
This data visualization exercise uses D3.js to show historical carbon, future scenarios developed by the Intergovernmental Panel on Climate Change (IPCC), and the recommended limit of 350 ppm.
This data visualization exercise uses D3.js to show historical carbon, future scenarios developed by the Intergovernmental Panel on Climate Change (IPCC), and the recommended limit of 350 ppm.