Global Literacy Data


Using mobile devices with GPS and text messaging, people in areas without formalized public transit are increasingly invited to contribute to the mapping of local service and travel routes.
This map shows the locations of some participatory mapping projects. It is implemented using OpenStreetMap and Leaflet.js.
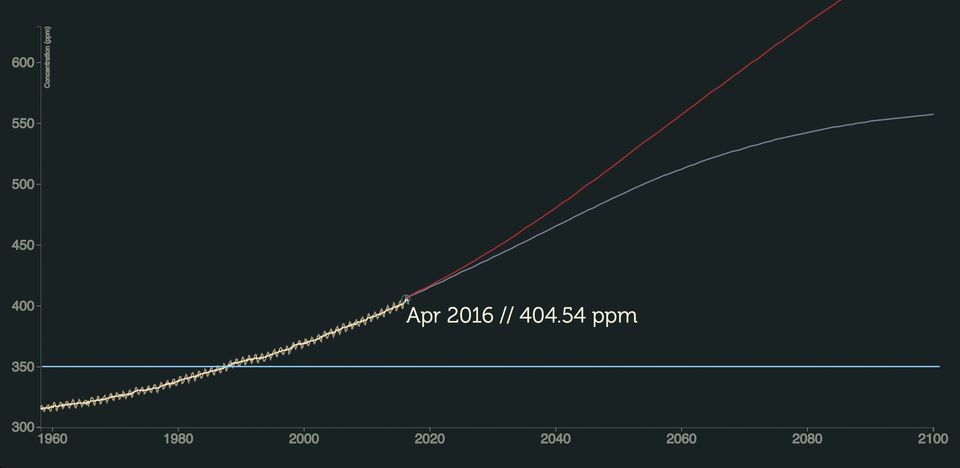
This data visualization exercise uses D3.js to show historical carbon, future scenarios developed by the Intergovernmental Panel on Climate Change (IPCC), and the recommended limit of 350 ppm.